


Dashboard for Wialon

คำอธิบายของDashboard for Wialon
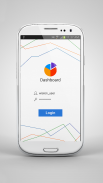
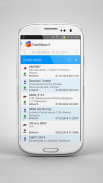
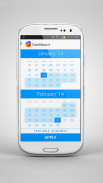
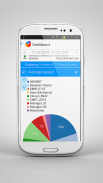
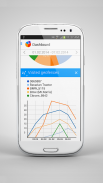
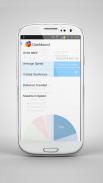
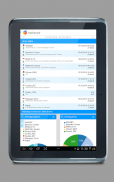
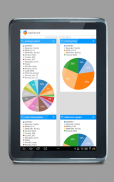
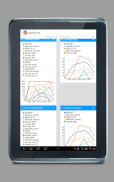
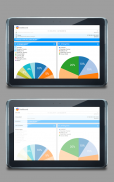
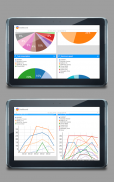
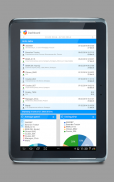
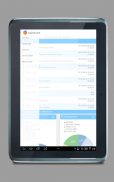
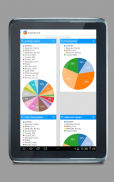
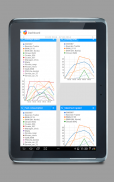
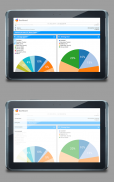
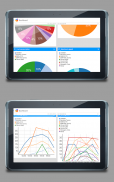
Multifunctional telematics solution by Gurtam, which capabilities extend far beyond simple GPS vehicle tracking. Dashboard provides at-a-glance views of KPIs (key performance indicators) relevant to a particular objective or business process. In our case, Dashboard is an effective Apps, providing overview of fleet KPIs in an easy to read real-time user interface to enable instantaneous and informed decisions to be made immediately. KPIs include Mileage, Fuel consumption, Engine hours, Average and Maximum speed, Idling, Time in trips and visited Geofences. So, you can build all the necessary diagrams by units or unit groups. You can make any diagram you want, for example, mileage diagram for days, weeks, or just for one day. Also, it’s possible to choose the diagram type you like: line, column or pie chart.
วิธีการแก้ปัญหาโดย telematics มัลติฟังก์ชั่ Gurtam ซึ่งความสามารถในการขยายไกลเกินการติดตามยานพาหนะ GPS ง่าย แดชบอร์ดให้มุมมองที่ภาพรวมของตัวชี้วัด (ตัวชี้วัด) ที่เกี่ยวข้องกับกระบวนการวัตถุประสงค์หรือธุรกิจโดยเฉพาะอย่างยิ่ง ในกรณีของเราแดชบอร์ดเป็น Apps ที่มีประสิทธิภาพให้ภาพรวมของตัวชี้วัดในเรือเดินสมุทรง่ายต่อการอ่านเวลาจริงส่วนติดต่อผู้ใช้ที่จะช่วยให้การตัดสินใจทันทีและแจ้งที่จะทำทันที ตัวชี้วัดรวมถึงการสะสมไมล์การบริโภคน้ำมันเชื้อเพลิงเครื่องยนต์ชั่วโมงเฉลี่ยและความเร็วสูงสุด Idling เวลาในการเดินทางและเยี่ยมชม geofences ดังนั้นคุณสามารถสร้างแผนภาพที่จำเป็นทั้งหมดโดยหน่วยหรือกลุ่มหน่วย คุณสามารถสร้างแผนภาพที่คุณต้องการตัวอย่างเช่นแผนภาพไมล์สะสมสำหรับวันสัปดาห์หรือเพียงแค่หนึ่งวัน นอกจากนี้ก็เป็นไปได้ที่จะเลือกประเภทแผนภาพที่คุณชอบ: สายคอลัมน์หรือแผนภูมิวงกลม
Dashboard for Wialon--เวอร์ชั่น1.2.61
(12-03-2020)
Dashboard for Wialon - ข้อมูล APK
เวอร์ชั่น APK: 1.2.61แพ็คเกจ: com.gurtam.dashboardเวอร์ชั่นล่าสุดของDashboard for Wialon
เวอร์ชั่นอื่น


แอปในประเภทเดียวกัน


